Aura Announces Q3 2025 and 9M 2025 Financial and Operational Results
ROAD TOWN, British Virgin Islands, Nov. 04, 2025 (GLOBE NEWSWIRE) -- Aura Minerals Inc. (NASDAQ: AUGO) (B3: AURA33) (“Aura” or the “Company”) announces that it has filed its audited consolidated financial statements and earnings release (together, “Financial and Operational Results”) for the period ended September 30, 2025. The full version of the Financial and Operational Results can be viewed on the Company’s website at www.auraminerals.com, on SEDAR+ at www.sedarplus.ca. or on SEC www.sec.com.
“In Q3 2025, Aura achieved a record production of 74,227 GEO at constant prices and an all-time high Adjusted EBITDA of US$152 million, contributing to a trailing twelve-month Adjusted EBITDA of US$419 million at an average realized gold price of US$3,068/oz. This performance, bolstered by a realized gold price of US$3,385/oz and Recurring Free Cash Flow of US$115 million in the quarter —up 91% from Q2 2025—was driven by strong operational results across our mines and the successful start of commercial production at Borborema in September 2025, built on time and on budget with zero Lost Time Incidents. Our cost discipline - AISC decreased by 4% compared to Q2 2025 - and Aura 360 commitment enabled us to maintain robust financial performance. We remain focused on delivering consistent shareholder value through our quarterly dividend, advancing the MSG acquisition, and achieving our 2025 production and cost guidance of 266,000-300,000 GEO,” commented Rodrigo Barbosa President and CEO of Aura.
Operational & Financial Headlines Q3 2025 and 9M 2025
| (US$ thousand) | Q3 2025 | Q2 2025 | QoQ Change % |
Q3 2024 | YoY Change% |
9M 2025 | 9M 2024 | Change % | ||||||||
| Total Production (GEO) | 74,227 | 64,033 | 16 | % | 68,246 | 9 | % | 198,346 | 200,759 | -1 | % | |||||
| Total Sales (GEO) | 74,907 | 62,452 | 20 | % | 67,069 | 12 | % | 197,850 | 200,517 | -1 | % | |||||
| Net Revenue | 247,832 | 190,436 | 30 | % | 156,157 | 59 | % | 600,072 | 422,646 | 42 | % | |||||
| Gross Profit | 149,609 | 103,939 | 44 | % | 72,181 | 107 | % | 331,976 | 170,171 | 95 | % | |||||
| Gross Margin | 60 | % | 55 | % | 6p.p. | 46 | % | 14p.p. | 55 | % | 40 | % | 15p.p. | |||
| Adjusted EBITDA | 152,105 | 106,224 | 43 | % | 77,974 | 95 | % | 339,808 | 186,813 | 82 | % | |||||
| Adjusted EBITDA Margin | 61 | % | 56 | % | 6p.p. | 50 | % | 11p.p. | 57 | % | 44 | % | 12p.p. | |||
| Net Income | 5,626 | 8,147 | -31 | % | (11,923 | ) | -147 | % | (59,476 | ) | (46,915 | ) | -27 | % | ||
| Net Income Margin | 2 | % | 4 | % | -2p.p. | -8 | % | 10p.p. | -10 | % | -11 | % | 1p.p. | |||
| Adjusted Net Income | 68,672 | 36,834 | 86 | % | 21,650 | 217 | % | 132,409 | 44,630 | 197 | % | |||||
| Cash Cost (US$/GEO) | 1,110 | 1,146 | -3 | % | 987 | 12 | % | 1,133 | 1,022 | 11 | % | |||||
| All In Sustaining cost (US$/GEO) | 1,396 | 1,449 | -4 | % | 1,292 | 8 | % | 1,433 | 1,302 | 10 | % | |||||
| Operating Cash Flow | 93,096 | 79,865 | 17 | % | 76,770 | 21 | % | 214,189 | 156,233 | 37 | % | |||||
| Net Debt/LTM EBITDA | 0.15x | 0.81x | -0.66x | 0.63x | -0.48x | 0.15x | 0.63x | -0.48x | ||||||||
| Total CAPEX | 31,605 | 50,325 | -37 | % | 60,483 | -48 | % | 133,655 | 113,761 | 17 | % | |||||
Except as otherwise noted in this document, references herein to “US$” or and “$” are to thousands of United States dollars
Headlines
- Total production in Q3 2025 reached 74,227 gold equivalent ounces (“GEO”), 16% higher than Q2 2025 and also 9% higher when compared to Q3 2024 at current metal prices. At constant prices, Aura’s quarterly production was a record high, increasing by 17% compared to Q2 2025 and increasing 15% over Q3 2024. This result was achieved mainly due to:
- The increase production at Almas from 12,917 GEO in Q2 2025 to 15,088 GEO in Q3 2025 (+17%), due to higher ore processed volumes, reflecting the results of the plant expansion at Almas, and improved grades due to mine sequencing;
- The first full quarter of production at Borborema and its achievement of commercial production, producing 10,219 GEO in Q3 2025 (vs. 2,577 GEO in Q2 2025); and
- The reliable productions at Apoena, Aranzazu and Minosa, which, combined, remained stable in Q3 2025 compared to Q2 2025
In 9M 2025, the total production reached 198,346 GEO at current prices in line with the same period of 2024. At 2025 Production Guidance Prices, the 9M 2025 production was 203,592 GEO, 3% above 9M 2024, and on track to achieve the 2025 guidance.
- Sales volumes were 74,907 in GEO this quarter, an increase of 10% compared to Q3 2024 and an increase of 20% compared to the previous quarter at current prices quarter, mainly as result of increase in production.
- Net Revenues reached a record high of US$247,832 in Q3 2025, representing an increase of 59% compared to Q3 2024 and an increase of 30% when compared to Q2 2025, mainly due to higher gold price and the increase in sales volumes. In 9M 2025, revenues reached US$600,072, an increase of 42% compared to the same period of 2024.
- Average net realized gold sale prices increased by 6% in Q3 2025 compared to Q2 2025, with an average of US$3,385/oz in the quarter. Compared to Q3 2024, average net realized gold sale prices increased 40% (US$2,413). In 9M 2025, average net realized gold sale prices reached US$3,146, a 43% increase when compared to 9M 2024.
- Average copper sale prices increased 6% compared to Q2 2025, with an average of US$4.74/lb in the quarter and was 13% higher compared to the same period in 2024. In 9M 2025, average copper sale prices reached US$4.49, an 8% increase when compared to 9M 2024.
- Adjusted EBITDA reached another record high of US$152,105 in Q3 2025, marking the fifth consecutive quarterly record reported by Aura. The increase was driven by a combination of higher metal prices, cash costs under control (as further explained below) and increase in production and sales volumes. When compared to Q3 2024, Adjusted EBITDA reached a 95% increase. In 9M 2025, Adjusted EBITDA increased by 82%, for the same reasons.
- AISC for Q3 2025 was US$1,396/GEO, a decrease by 4% when compared to Q2 2025 (US$1,449/GEO), mainly due to better performance at Almas (AISC of US$ 1,128/GEO) due to higher ore processed and better grades and improved waste-to-ore ration due to mine sequencing, and as result of the start of operations at Borborema, which while yet in a ramp-up had a lower-than-average AISC profile and recorded an AISC of US$ 1,237/Oz. When compared to Q3 2024, the AISC increased 8% over Q3 2024 at current prices, mainly due to Aranzazu, which was negatively impacted by the conversion of copper into GEO due to the sharp increase in gold prices in the period . At constant Q3 2024 metal prices, AISC would have been in line compared to Q3 2024. In 9M 2025, AISC reached US$1,419, an 8% increase when compared to 9M 2024 at current prices and 3% increase in constant prices.
- The Company's Net Debt reached US$63,772 by Q3 2025 a 77% decrease compared to Q2 2025 and also a decrease of 56% when compared to the same period of 2024, due to (i) higher cash position due to the net proceeds from Nasdaq IPO of US$200.1 million, (ii) strong Recurring Free Cash Flows, and (ii) the significant reduction in the CAPEX 18.7 million, from US$50.3 million, in Q2 2025 to US$31.6million, a 37% decrease, mostly due to the conclusion of the Borborema construction. The net debt-to-last 12 months Adjusted EBITDA ratio reduced to 0.15x at the end of Q3 2025, from 0.81x at the end of Q2 2025.
OTHER UPDATES:
Exercise of the Underwriters’ Option to Purchase Additional Shares: In August 2025, Aura closed the sale of 897,134 common shares for approximately US$21.8 million as a result of the partial exercise of the underwriters’ option to purchase additional shares granted to them in connection with the U.S. Initial Public Offering at the public offering price of US$24.25 per common share, less underwriting discounts and commissions.
Delist from Toronto Stock Exchange (TSX): On September 8th, 2025, Aura decided to pursue the Delisting of the Common Shares from the TSX following the completion of listing its Common Shares on Nasdaq on July 16th, 2025, along with its intention to consolidate the trading in the U.S. equity market, which the Company expects will improve its stock liquidity. This change was approved by the Brazilian Securities Commission (“Comissão de Valores Mobiliários“ or “CVM”), since it does not affect the rights of holders of BDRs listed on the São Paulo Stock Exchange (B3 S.A. – Brasil, Bolsa, Balcão) under the symbol "AURA33”, which continued to be supported by Common Shares, listed on Nasdaq. This change took effect on September 5, 2025 and the shares were no longer traded on the TSX as of September 25, 2025.
Borborema commercial production: On September 23rd, 2025, Aura announced the beginning of Borborema gold mine commercial production. The Borborema mine mill operates above 80% of the design capacity, processing 4,500 tonnes per day, with recoveries consistently above 90% and ranging up to 92%. The mine sold in Q3 2025 a total of 10,095 GEO. Borborema is poised to become a cornerstone asset for Aura, anticipated to deliver the second highest annual gold production among the Company’s five operating mines. Built in just 19 months with zero lost time incidents, the project exemplifies Aura’s commitment to developing simple, scalable, and efficient operations. It also sets a benchmark in ESG performance, incorporating renewable energy sources and utilizing grey water from the local municipality.
Incentive Program for the Conversion of BDRs into Shares: In October 2025, Aura announced to the holders of the Company’s Brazilian Depositary Receipts ("BDRs") the launch of the Incentive Program for the conversion of BDRs into common shares (“Incentive Program”), under which holders may request the conversion of their BDRs (“AURA33”) into the underlying common shares (“AUGO”) listed on Nasdaq (“common shares”), at a ratio of three to one, without being required to pay the applicable fees charged by Banco Bradesco. The Incentive Program is available for a fixed period of 32 days, from October 6, 2025, to November 6, 2025 (“Subsidy Period”).
Results Teleconference:
Date: November 5, 2025
Time: 10 a.m. (Brasília) | 8 a.m. (New York and Toronto)
Link to access: Click here
2. Consolidated Financial Results
In terms of production and sales, for all assets except Aranzazu, references herein to “GEO” are equivalent to actual gold ounces.
2.1 Total Production and Sales (GEO)
| (GEO) | Q3 2025 | Q2 2025 |
QoQ Change % |
Q3 2024 |
YoY Change% |
9M 2025 | 9M 2024 | Change % | |||
| Production | |||||||||||
| Aranzazu | 21,534 | 22,281 | -3 | % | 24,486 | -12 | % | 64,271 | 74,196 | -13 | % |
| Apoena | 9,248 | 8,219 | 13 | % | 8,035 | 15 | % | 26,343 | 30,052 | -12 | % |
| Minosa | 18,138 | 18,039 | 1 | % | 20,750 | -13 | % | 53,831 | 59,078 | -9 | % |
| Almas | 15,088 | 12,917 | 17 | % | 14,975 | 1 | % | 41,107 | 37,459 | 10 | % |
| Borborema | 10,219 | 2,577 | 297 | % | 0 | N.A. | 12,796 | 0 | N.A. | ||
| Total | 74,227 | 64,033 | 16 | % | 68,246 | 9 | % | 198,346 | 200,785 | -1 | % |
| (GEO) | Q3 2025 | Q2 2025 |
QoQ Change % |
Q3 2024 |
YoY Change% |
9M 2025 | 9M 2024 | Change % | |||
| Sales | |||||||||||
| Aranzazu | 21,514 | 22,290 | -3 | % | 23,380 | -8 | % | 64,260 | 74,269 | -13 | % |
| Apoena | 9,249 | 8,219 | 13 | % | 7,957 | 16 | % | 26,876 | 29,075 | -8 | % |
| Minosa | 17,827 | 17,836 | 0 | % | 20,757 | -14 | % | 53,189 | 59,723 | -11 | % |
| Almas | 15,089 | 12,917 | 17 | % | 14,975 | 1 | % | 41,107 | 37,450 | 10 | % |
| Borborema | 11,228 | 1,190 | 843 | % | 0 | N.A. | 12,418 | 0 | N.A. | ||
| Total | 74,907 | 62,452 | 20 | % | 67,069 | 12 | % | 197,850 | 200,517 | -1 | % |
Applies the metal sale prices in Aranzazu realized during Q3 2025: Copper price = US$4.45/lb; Gold Price = US$3,477/oz; Silver Price = US$40.03/oz and Molybdenum Price = US$25.02/oz.
Total production in Q3 2025 reached 74,227 gold equivalent ounces (“GEO”), 16% higher than Q2 2025 and 9% higher when compared to Q3 2024 at current metal prices, mainly due to negative impact from the copper-to-GEO conversion at Aranzazu. At constant prices, Aura’s quarterly production was record high, increasing by 17% compared to Q2 2025 and 15% above Q3 2024. When compared to the last quarter, the result was mainly attributable to stronger operational performance driven by higher ore processed volumes and improved grades at Almas and the production increase of Borborema.
During the quarter, Aura announced the beginning of commercial operation of Borborema — anticipated to be one of the Company’s largest and lowest cash cost operations. In the quarter, Borborema’s production totaled 10,219 GEO.
In 9M 2025, production reached 198,346 GEO, representing a 1% decline in current metal prices. At constant prices — which neutralize the effect of copper price fluctuations in the GEO conversion at Aranzazu —production had an increase of 5% over the 185,979 GEO produced in 9M 2024, also due to Borborema production and Almas improvements. At 2025 Production Guidance Prices, the 9M 2025 production was 203,592 GEO, 3% above 9M 2024, and on track to achieve the 2025 guidance.
At current metal prices, production in Q3 2025 represents 75% of the lower end and 66% of the upper end of the full-year guidance. At 2025 Production Guidance Prices, the 9M 2025 production was 203,592 GEO, representing 77% of the lower end and 68% of the upper end of the full-year guidance. This performance reinforces the Company’s confidence in achieving its 2025 guidance.
2.2. Net Revenue
| (US$ thousand) | Q3 2025 | Q2 2025 |
QoQ Change % |
Q3 2024 |
YoY Change % |
9M 2025 | 9M 2024 | Change % | |||
| Aranzazu | 67,094 | 62,508 | 36 | % | 50,721 | 32 | % | 179,864 | 144,123 | 25 | % |
| Apoena | 31,223 | 26,711 | 67 | % | 19,250 | 64 | % | 84,287 | 64,249 | 31 | % |
| Minosa | 59,204 | 55,776 | 41 | % | 49,184 | 20 | % | 163,042 | 128,793 | 27 | % |
| Almas | 51,329 | 41,751 | 112 | % | 37,002 | 39 | % | 130,207 | 85,481 | 52 | % |
| Borborema | 38,982 | 3,690 | N.A. | - | N.A. | 42,672 | - | N.A. | |||
| Total | 247,832 | 190,436 | 85 | % | 156,157 | 59 | % | 600,072 | 422,646 | 42 | % |
In Q3 2025, the Company reported Net Revenue of US$247.8 million, representing a 59% increase year-over-year and a 30% increase compared to Q2 2025. The strong performance was primarily driven by the sales increase and higher metal prices, with the average realized gold price increasing by 40%, from US$2,413/oz in Q3 2024 to US$3,385/oz in Q3 2025. Copper prices also contributed positively, with the average copper price increasing by 13%, from US$4.18/lb in Q3 2024 to US$4.74/lb in Q3 2025. Compared to the last quarter, molybdenum average realized sale price also increased by 15%, reaching US$25/lb.
With this result, Net Revenues reached US$600,072 in 9M 2025, an increase of 42% when compared to the same period of 2024. The result was mainly driven by higher gold prices, higher sales at Almas and of the start of operations at Borborema. In 9M 2025, average net realized prices reached US$3,146, a 43% increase when compared to 9M 2024; and average copper prices reached US$4.49/lb, an 8% increase when compared to 9M 2024.
2.3. Cash Cost and All in Sustaining Costs
| (US$/GEO) | Q3 2025 | Q2 2025 |
QoQ Change% |
Q3 2024 |
YoY Change% |
9M 2025 | 9M 2024 | Change % | |||
| Cash Cost | 1,110 | 1,146 | -3 | % | 987 | 12 | % | 1,133 | 1,022 | 11 | % |
| Aranzazu | 1,133 | 1,110 | 2 | % | 997 | 14 | % | 1,135 | 960 | 18 | % |
| Apoena | 1,082 | 1,168 | -7 | % | 1,095 | -1 | % | 1,159 | 983 | 18 | % |
| Minosa | 1,192 | 1,178 | 1 | % | 998 | 20 | % | 1,173 | 1,090 | 8 | % |
| Almas | 986 | 1,167 | -16 | % | 899 | 10 | % | 1,069 | 1,065 | 0 | % |
| Borborema | 1,127 | 936 | 20 | % | - | N.A. | 1,109 | - | N.A. | ||
| All-in Sustaining Cost | 1,396 | 1,449 | -4 | % | 1,292 | 8 | % | 1,433 | 1,302 | 10 | % |
| Aranzazu | 1,511 | 1,514 | 0 | % | 1,338 | 13 | % | 1,523 | 1,269 | 20 | % |
| Apoena | 1,791 | 1,751 | 2 | % | 1,888 | -5 | % | 1,867 | 1,607 | 16 | % |
| Minosa | 1,372 | 2,292 | -40 | % | 1,089 | 26 | % | 1,305 | 1,176 | 11 | % |
| Almas | 1,128 | 1,364 | -17 | % | 1,182 | -5 | % | 1,223 | 1,330 | -8 | % |
| Borborema | 1,237 | 1,441 | -14 | % | - | 0 | % | 1,256 | - | 0 | % |
For Q3 2025, the Company’s Cash Cost was US$1,110/GEO, an increase of 12% over Q3 2024 mainly attributed to the increase in costs at Aranzazu, due to impact from the copper-to-GEO conversion in production, and lower production at Minosa. When compared to Q2 2025, Cash Cost was 3% lower, due to improvements at Almas and Apoena driven by higher grades and higher recovery rates, respectively, partially offset by higher costs at Aranzazu and Borborema.
In 9M 2025, Cash Cost averaged US$1,133/GEO, representing an 11% increase, mainly due to lower grades at Apoena and higher waste to ore ratio and the impact of the copper into GEO conversion at Aranzazu. This result was also impacted by lower stacking at Minosa due to higher rainfall in 2025 than 2024, due to the unusually low rain season in Minosa in 2024. At constant 2024 metal prices, Cash Cost of 9M 2025 was US$1,060/GEO, a 4% increase.
In Q3 2025, consolidated All-in Sustaining Cost (AISC) was US$1,396/GEO, up 8% from Q3 2024 due to higher Cash Costs and partially explained by the negative impact of metal prices on GEO conversion. At Q3 2024 constant metal prices, AISC was in line with Q3 2024. For 9M 2025, AISC was US$1,419/GEO, a 9% increase from 9M 2024, mainly due to copper-to-GEO conversion. Compared to Q2 2025, AISC reduced 4% due to the positive performance of Almas and lower than Aura’s average AISC for Borborema.
2.4. Gross Profit
| (US$ thousand) | Q3 2025 | Q2 2025 |
QoQ Change% |
Q3 2024 |
YoY Change% |
9M 2025 | 9M 2024 | Change% | ||||||||
| Net Revenue | 247,832 | 190,436 | 30 | % | 156,157 | 59 | % | 600,072 | 422,646 | 42 | % | |||||
| Cost of goods sold | (98,223 | ) | (86,497 | ) | 14 | % | (83,976 | ) | 17 | % | (268,096 | ) | (252,475 | ) | 6 | % |
| Cost of production | (44,745 | ) | (44,470 | ) | 1 | % | (29,838 | ) | 50 | % | (134,134 | ) | (104,899 | ) | 28 | % |
| Cost of production - Contractors | (26,437 | ) | (17,529 | ) | 51 | % | (27,481 | ) | -4 | % | (59,433 | ) | (69,861 | ) | -15 | % |
| Change in inventory (cash) | (11,983 | ) | (9,550 | ) | 25 | % | (9,971 | ) | 20 | % | (30,659 | ) | (30,138 | ) | 2 | % |
| Depreciation and amortization | (15,058 | ) | (14,948 | ) | 1 | % | (16,686 | ) | -10 | % | (43,870 | ) | (47,577 | ) | -8 | % |
| Gross Profit | 149,609 | 103,939 | 44 | % | 72,181 | 107 | % | 331,976 | 170,171 | 95 | % | |||||
| Gross Margin | 60 | % | 55 | % | 6 p.p. | 46 | % | 14 p.p. | 55 | % | 40 | % | 15 p.p. | |||
In the quarter, Cost of goods sold (COGS) was directly impacted by the inclusion of Borborema and reflected an increase of 14% compared to Q2 2025 and 17% versus Q3 2024. In Q3 2025, Borborema accounted for US$12.9 million in costs. Excluding this impact, total COGS for the quarter would have been approximately US$85.6 million, consistent with Q2 2025 levels. For 9M 2025, total COGS rose 6%, also driven by Borborema’s start up, which represented US$13.8 million of the total. Excluding Borborema, cost increase versus 2024 would have been around 1%, demonstrating that, under comparable conditions, the Company maintained stable costs, reflecting Aura’s disciplined cost management and operational efficiency.
In Q3 2025, disciplined cost management, aligned with Q3 2024 on a comparable basis, and a significant rise in Net Revenue drove Gross Profit to US$149.6 million, achieving a Gross Margin of 60%. This represents a more than twofold increase from the US$72.2 million Gross Profit in Q3 2024. For 9M 2025, Gross Profit reached US$332.0 million, nearly doubling the 9M 2024 figure, propelled by cost containment strategies and a 42% increase in Net Revenue for the reasons discussed.
2.5. Operating Expenses
| (US$ thousand) | Q3 2025 | Q2 2025 |
QoQ Change % |
Q3 2024 |
YoY Change% |
9M 2025 | 9M 2024 | Change % | ||||||||
| Gross Profit | 149,609 | 103,939 | 44 | % | 72,181 | 107 | % | 331,976 | 170,171 | 95 | % | |||||
| Operational Expenses | (12,704 | ) | (12,998 | ) | -2 | % | (11,216 | ) | 13 | % | (36,714 | ) | (31,920 | ) | 15 | % |
| General and administrative expenses | (10,371 | ) | (11,284 | ) | -8 | % | (6,923 | ) | 50 | % | (31,291 | ) | (22,734 | ) | 38 | % |
| Exploration expenses | (2,333 | ) | (1,714 | ) | 36 | % | (4,293 | ) | -46 | % | (5,423 | ) | (9,186 | ) | -41 | % |
| Operating income | 136,905 | 90,941 | 51 | % | 60,965 | 125 | % | 295,262 | 138,251 | 114 | % |
Operating Expenses totaled US$12.7 million in the quarter, 2% lower than Q2 2025 and 13% higher than Q3 2024.
General and Administrative (“G&A”) expenses decreased by 8% compared to Q2 2025, primarily reflecting the absence of certain non-recurring expenses related to the Nasdaq IPO incurred in the previous quarter. When compared to Q3 2024, G&A expenses increased by US$3.5 million, mainly due to: (i) higher stock-based compensation (non-cash) and Deferred Share Unit (“DSU”) expenses, driven by the significant appreciation in the Company’s share price during the period; (ii) increased Directors and Officers (“D&O”) insurance premiums following the Nasdaq listing; and (iii) an increase in other general and administrative costs.
For the nine months ended September 30, 2025, the increase in G&A expenses was driven by the same factors, as well as higher salaries and benefits and professional fees associated with the acquisition and incorporation of Era Dorada, the start-up of Borborema, and activities related to the Nasdaq IPO.
Exploration expenses totaled US$2.3 million in Q3 2025, a 36% increase compared to Q2 2025 and 46% reduction from Q3 2024, as most expenses related to exploration activities in the quarter were capitalized. Exploration activities in the quarter were concentrated in Apoena. In Matupá, efforts were focused on expanding reserves in regions close to X1, Pé Quente and other strategic areas. In Carajás, exploration work successfully confirmed copper mineralization, expanding the mineral potential of the region.
The Company thus ended Q3 2025 with Operating Income of US$137.6 million, compared to an Operating Income of US$90.9 million in Q3 2024, also higher compared to the Operating Income of Q2 2025 of US$90.9 million, which reflects a positive result of higher gross profit.
2.6. Adjusted EBITDA
| (US$ thousand) | Q3 2025 | Q2 2025 |
QoQ Change % |
Q3 2024 |
YoY Change% |
9M 2025 | 9M 2024 | Change % | ||||||||
| Operating Income | 136,905 | 90,941 | 51 | % | 60,965 | 125 | % | 295,262 | 138,251 | 114 | % | |||||
| Depreciation and Amortization | 15,200 | 15,283 | -1 | % | 17,009 | -11 | % | 44,546 | 48,562 | -8 | % | |||||
| Adjusted EBITDA | 152,105 | 106,224 | 43 | % | 77,974 | 95 | % | 339,808 | 186,813 | 82 | % | |||||
| Adjusted EBITDA Margin | 61 | % | 56 | % | 6 p.p. | 50 | % | 11 p.p. | 57 | % | 44 | % | 12 p.p. | |||
Adjusted EBITDA reached a new all-time high of US$152.1 million in Q3 2025, marking the fifth consecutive quarterly record for Aura. The Company’s increase in production, while maintaining disciplined cost control, enabled it to fully capture the benefit of rising metal prices. As a result, Adjusted EBITDA almost doubled compared to Q3 2024 and grew 43% over Q2 2025.
The year-over-year improvement was primarily driven by higher production and sales volumes, strong cost control and higher gold and copper prices, as discussed previously. This result was also noted on the EBITDA margin gain of 6 p.p. compared to Q2 2025, supported not only by stronger metal prices but also by a 20% increase in sales volume.
In 9M 2025, Adjusted EBITDA reached US$339.8 million, representing an 82% increase compared to the same period in 2024. This result reflects also the positive impact of higher metal prices and increases in production. As a result, the Adjusted EBITDA margin expanded to 57%, up from 44% in 9M 2024.
2.7. Financial Result
| (US$ thousand) | Q3 2025 | Q2 2025 |
QoQ Change % |
Q3 2024 |
YoY Change% |
9M 2025 | 9M 2024 | Change % | ||||||||
| EBIT | 136,905 | 90,941 | 51 | % | 60,965 | 125 | % | 295,262 | 138,251 | 114 | % | |||||
| Financial Result | (102,565 | ) | (59,630 | ) | 72 | % | (62,691 | ) | 64 | % | (283,806 | ) | (141,888 | ) | 100 | % |
| Accretion expense | (2,980 | ) | (1,134 | ) | 163 | % | (1,447 | ) | 106 | % | (5,780 | ) | (4,553 | ) | 27 | % |
| Lease interest expense | (824 | ) | (161 | ) | 412 | % | (2,758 | ) | -70 | % | (2,580 | ) | (6,779 | ) | -62 | % |
| Interest expense on loans and debentures | (5,786 | ) | (6,098 | ) | -5 | % | (7,278 | ) | -21 | % | (17,639 | ) | (15,616 | ) | 13 | % |
| Finance cost on post-employment benefit | (535 | ) | (747 | ) | -28 | % | (415 | ) | 29 | % | (1,620 | ) | (1,249 | ) | 30 | % |
| Unrealized loss with derivative gold collars | (75,252 | ) | (24,304 | ) | 210 | % | (56,267 | ) | 34 | % | (199,766 | ) | (89,493 | ) | 123 | % |
| Realized loss with derivative gold collars | (17,130 | ) | (11,703 | ) | 46 | % | - | N.A. | (34,869 | ) | - | N.A. | ||||
| Loss on other derivative transactions | (685 | ) | (1,305 | ) | -48 | % | (1,321 | ) | -48 | % | (3,817 | ) | (1,321 | ) | 189 | % |
| Change in liability measured at fair value | (1,036 | ) | (4,025 | ) | -74 | % | - | N.A. | (7,420 | ) | (85 | ) | N.A. | |||
| Foreign exchange | (36 | ) | (2,462 | ) | -99 | % | - | N.A. | (5,674 | ) | (10,995 | ) | -48 | % | ||
| Derivative fee | - | - | N.A. | - | N.A. | - | (13,522 | ) | N.A. | |||||||
| Loss on settlement of liability with equity instruments | - | (8,768 | ) | N.A. | - | N.A. | (8,768 | ) | - | N.A. | ||||||
| Other finance costs | (585 | ) | (297 | ) | 97 | % | (476 | ) | 23 | % | (1,312 | ) | (1,047 | ) | 25 | % |
| Finance expenses | (104,849 | ) | (61,004 | ) | 72 | % | (69,962 | ) | 50 | % | (289,245 | ) | (144,660 | ) | 100 | % |
| Change in liability measured at fair value | - | - | N.A. | 3,502 | N.A. | - | - | N.A. | ||||||||
| Foreign exchange | - | - | N.A. | 2,279 | N.A. | - | - | N.A. | ||||||||
| Interest income | 2,284 | 1,374 | 66 | % | 1,490 | 53 | % | 5,439 | 2,772 | 96 | % | |||||
| Finance income | 2,284 | 1,374 | 66 | % | 7,271 | -69 | % | 5,439 | 2,772 | 96 | % | |||||
| Other income (expenses) | (822 | ) | 61 | N.A. | (359 | ) | 129 | % | (1,515 | ) | (952 | ) | 59 | % | ||
| Profit/ (loss) before income taxes | 33,518 | 31,372 | 7 | % | (2,085 | ) | N.A. | 9,941 | (4,589 | ) | N.A. | |||||
The Company’s Financial Result in Q3 2025 was a loss of US$(102.6) million, following on from the US$(59.6) million loss in Q2 2025, impacted by:
- Unrealized loss on gold hedges in Q3 2025, arising from mark-to-market (MTM) adjustments related to outstanding gold hedge positions, reflecting increase in gold prices between the start and the end of the quarter, coming from US$3,287.45 per Oz and reaching US$ 3,825.30 per Oz at the end of the period. In accordance with IFRS standards, the Company records MTM adjustments at the end of each reporting period for all outstanding derivative positions.
- Realized losses with gold hedges in Q3 2025 were related to cash settlement of outstanding gold collars during the quarter, driven by the expiration of gold collars within the quarter.
Most of Aura’s outstanding gold collars (213,192 Ozs out of about 214,442 Ozs) are associated with the future production of the Borborema and will expire between October/2025 and Jun/2028. As previously disclosed, about 80% of the production for the first 3 years of the Borborema Project is hedged at ceiling prices of US$2,400.
2.8. Net Income
| (US$ thousand) | Q3 2025 | Q2 2025 |
QoQ Change % |
Q3 2024 |
YoY Change% |
9M 2025 | 9M 2024 | Change % | ||||||||
| Profit/ (loss) before income taxes | 33,518 | 31,372 | 7 | % | (2,085 | ) | N.A. | 9,941 | (4,589 | ) | N.A. | |||||
| Total taxes | (27,892 | ) | (23,225 | ) | 20 | % | (9,838 | ) | 293 | % | (69,417 | ) | (42,326 | ) | 64 | % |
| Current income tax expense | (38,402 | ) | (29,551 | ) | 30 | % | (11,833 | ) | 225 | % | (88,767 | ) | (36,588 | ) | 143 | % |
| Deferred income tax expense | 10,510 | 6,326 | N.A. | 1,995 | N.A. | 19,350 | (5,738 | ) | N.A. | |||||||
| Profit/(loss) for the period | 5,626 | 8,147 | -31 | % | (11,923 | ) | -147 | % | (59,476 | ) | (46,915 | ) | 27 | % | ||
| Net Margin | 2 | % | 4 | % | -2 p.p. | -8 | % | 10 p.p. | -10 | % | -11 | % | 1 p.p. | |||
| Unrealized loss with derivative gold collars | (75,252 | ) | (24,304 | ) | 210 | % | (56,267 | ) | 34%. | (199,766 | ) | (89,493 | ) | 123 | % | |
| Foreign Exchange | (36 | ) | (2,462 | ) | -99 | % | 2,279 | N.A. | (5,674 | ) | (10,995 | ) | -48 | % | ||
| Deferred taxes on non-monetary items | 12,242 | 6,847 | 95 | % | 20,415 | -35 | % | 22,323 | 8,943 | 162 | % | |||||
| Loss on settlement of liability with equity instruments | - | (8,768 | ) | N.A. | - | N.A. | (8,768 | ) | - | N.A. | ||||||
| Adjusted Net Income | 68,672 | 36,834 | 86 | % | 21,650 | 217 | % | 132,409 | 44,630 | 197%. | ||||||
Net income in Q3 2025 was US$5.6 million, compared to Net Loss of US$(11.9) million in Q3 2024 and a Net income of US$8.1 million in Q2 2025. This result versus Q3 2024 occurred mainly due to higher operating income, which increased by 125% as a result of revenue growth, partially offset by higher financial expenses related to gold derivative losses and higher current income taxes, as expected given the operating income increase.
In 9M 2025, Net Loss reached US$(59.5) million, also mainly due to mark-to-market (MTM) adjustments on open gold hedging positions, driven by increase in gold price between the start and the end of the period.
Adjusted Net Income
As result of increase in the Company’s Operating Income, adjusted net income in Q3 2025 was US$68.7 million in the period, compared to US$34.6 million in Q3 2024, excluding:
- Non-cash losses related to gold hedges: US$(75.2) million
- FX losses: US$(0.36) million
- Deferred taxes over non-monetary items US$12.2 million
3. Performance of the Operating Units
3.1 Aranzazu
| (US$ thousand) | Q3 2025 | Q2 2025 |
QoQ Change % |
Q3 2024 |
YoY Change% |
9M 2025 | 9M 2024 | Change % | ||||||||
| Production at Constant Prices (GEO)¹ | 21,534 | 21,805 | -1 | % | 20,648 | 4 | % | 62,046 | 59,399 | 4 | % | |||||
| Production at Current Prices (GEO) | 21,534 | 22,281 | -3 | % | 24,486 | -12 | % | 64,271 | 74,179 | -13 | % | |||||
| Sales (GEO) | 21,514 | 22,290 | -3 | % | 23,380 | -8 | % | 64,260 | 74,269 | -13 | % | |||||
| Cash Cost (US$/GEO) | 1,133 | 1,110 | 2 | % | 997 | 14 | % | 1,135 | 960 | 18 | % | |||||
| AISC (US$/GEO) | 1,511 | 1,514 | 0 | % | 1,338 | 13 | % | 1,523 | 1,269 | 20 | % | |||||
| Net Revenue | 67,094 | 62,508 | 7 | % | 50,721 | 32 | % | 179,864 | 144,123 | 25 | % | |||||
| Cost of goods sold | (29,631 | ) | (31,021 | ) | -4 | % | (32,036 | ) | -8 | % | (90,934 | ) | (90,166 | ) | 1 | % |
| Gross Profit | 37,463 | 31,487 | 19 | % | 18,685 | 100 | % | 88,930 | 53,957 | 65 | % | |||||
| Expenses | (2,459 | ) | (2,310 | ) | 6 | % | (1,952 | ) | 26 | % | (7,252 | ) | (6,962 | ) | 4 | % |
| General and administrative expenses | (1,784 | ) | (1,516 | ) | 18 | % | (759 | ) | 135 | % | (5,074 | ) | (3,003 | ) | 69 | % |
| Exploration expenses | (675 | ) | (794 | ) | -15 | % | (1,193 | ) | -43 | % | (2,178 | ) | (3,959 | ) | -45 | % |
| EBIT | 35,004 | 29,177 | 20 | % | 16,733 | 109 | % | 81,678 | 46,995 | 74 | % | |||||
| Adjusted EBITDA | 39,646 | 35,684 | 11 | % | 24,361 | 63 | % | 99,900 | 65,863 | 52 | % | |||||
| Financial Result | (2,441 | ) | (4,292 | ) | -43 | % | (982 | ) | 149 | % | (7,339 | ) | (2,657 | ) | 176 | % |
| Financial expenses | (2,173 | ) | (3,762 | ) | -42 | % | (432 | ) | 403 | % | (5,969 | ) | (1,180 | ) | 406 | % |
| Other income (expenses) | (268 | ) | (530 | ) | -49 | % | (550 | ) | -51 | % | (1,370 | ) | (1,477 | ) | -7 | % |
| EBT | 32,563 | 24,885 | 31 | % | 15,751 | 107 | % | 74,339 | 44,338 | 68 | % | |||||
| Total taxes | (8,088 | ) | (12,532 | ) | -35 | % | (7,170 | ) | 13 | % | (28,003 | ) | (18,400 | ) | 52 | % |
| Current income tax expense | (10,248 | ) | (13,035 | ) | -21 | % | (7,057 | ) | 45 | % | (29,714 | ) | (19,348 | ) | 54 | % |
| Deferred income tax expense | 2,160 | 503 | 329 | % | (113 | ) | N.A. | 1,711 | 948 | 80 | % | |||||
| Profit for the period | 24,475 | 12,353 | 98 | % | 8,581 | 185 | % | 46,336 | 25,938 | 79 | % | |||||
Note: Applies the metal sale prices in Aranzazu realized during Q3 2025: Copper price = US$4.45/lb; Gold Price = US$3,477/oz; Silver Price = US$40.03/oz and Molybdenum Price = US$25.02/oz.
At Aranzazu, production reached 21,534 GEO, representing a 3% decrease compared to the previous quarter, resulting mainly from metal prices since higher gold prices negatively impact the conversion to GEO. When compared to Q3 2024, production decreased by 12% also due to the sharp increase in gold prices between the periods which also impacted GEO conversion. At constant prices, Aranzazu production was in line when compared to Q2 2025 (21,805 GEO) and 4% higher when compared to Q3 2024, also due to higher copper and silver grades, closing the quarter with copper grade of 1.55% and silver grade of 22.26 g/tonne. In the 9M 2025, total production at current prices decreased by 13% compared to the previous quarter, reaching 64,271, in line with the negative impact of the metals price conversion. At 9M 2024 constant prices, Aranzazu produced 62,046 GEO, 4% higher than the same period of the previous year, mainly due to higher grades – around 4% of gold and silver, closing the period with an average of 0.86 g/tonne and 22.24 g/tonne, respectively - and molybdenum production.
Aranzazu’s Net Revenue in Q3 2025 was US$67.1 million, up 7% from Q2 2025 and 32% from Q3 2024, primarily driven by higher metal prices. Average sales prices rose quarter-over-quarter, with copper increasing 3%, gold 6%, silver 19%, and molybdenum 15%. For 9M 2025, Aranzazu’s Net Revenue reached US$179.9 million, a 25% increase over 9M 2024, also attributed to elevated metal prices.
The Cash Cost was US$1,133/GEO for the quarter, 2% higher than Q2 2025 and 14% higher than Q3 2024, with slightly lower grades and recovery. In 9M 2025, Cash Cost increased by 18%, with a total of US$1,135/GEO, primarily impacted by the effect of metal prices in the conversion to GEO.
Aranzazu’s AISC was US$1,511 in the quarter, consistent with Q2 2025 but up 13% from Q3 2024, primarily due to variations in metal prices and increased G&A expenses. At constant Q3 2024 metal prices, AISC was US$1,273/GEO. For 9M 2025, AISC at constant metal prices reduced 5% from 9M 2024.
Aranzazu’s Adjusted EBITDA was US$39.6 million in Q3 2025, reflecting an 11% increase from Q2 2025 and a 63% surge compared to Q3 2024, driven by robust Net Revenue growth from higher metal prices. For 9M 2025, Adjusted EBITDA totaled US$99.9 million, up 52% from 9M 2024, propelled by a 25% increase in Net Revenue, primarily from elevated metal prices and stable Cost of Goods Sold.
3.2 Apoena
| (US$ thousand) | Q3 2025 | Q2 2025 |
QoQ Change % |
Q3 2024 |
YoY Change% |
9M 2025 | 9M 2024 | Change % | ||||||||
| Production (GEO) | 9,248 | 8,219 | 13 | % | 8,035 | 15 | % | 26,343 | 30,052 | -12 | % | |||||
| Sales (GEO) | 9,249 | 8,219 | 13 | % | 7,957 | 16 | % | 26,876 | 29,075 | -8 | % | |||||
| Cash Cost (US$/GEO) | 1,082 | 1,168 | -7 | % | 1,095 | -1 | % | 1,159 | 983 | 18 | % | |||||
| AISC (US$/GEO) | 1,791 | 1,751 | 2 | % | 1,888 | -5 | % | 1,867 | 1,607 | 16 | % | |||||
| Net Revenue | 31,223 | 26,711 | 17 | % | 19,250 | 62 | % | 84,287 | 64,249 | 31 | % | |||||
| Cost of goods sold | (15,307 | ) | (14,270 | ) | 7 | % | (14,561 | ) | 5 | % | (44,681 | ) | (46,310 | ) | -4 | % |
| Gross Profit | 15,916 | 12,441 | 28 | % | 4,689 | 239 | % | 39,606 | 17,939 | 121 | % | |||||
| Expenses | (374 | ) | (998 | ) | -63 | % | (931 | ) | -60 | % | (2,797 | ) | (3,106 | ) | -10 | % |
| General and administrative expenses | (292 | ) | (936 | ) | -69 | % | (802 | ) | -64 | % | (2,529 | ) | (2,807 | ) | -10 | % |
| Exploration expenses | (82 | ) | (62 | ) | 32 | % | (129 | ) | -36 | % | (268 | ) | (299 | ) | -10 | % |
| EBIT | 15,542 | 11,443 | 36 | % | 3,758 | 314 | % | 36,809 | 14,833 | 148 | % | |||||
| Adjusted EBITDA | 20,735 | 16,151 | 28 | % | 9,645 | 115 | % | 50,432 | 32,691 | 54 | % | |||||
| Financial Result | (5,402 | ) | (1,453 | ) | 272 | % | (5,220 | ) | 3 | % | (13,422 | ) | (11,570 | ) | 16 | % |
| Financial expenses | (5,386 | ) | (1,497 | ) | 260 | % | (5,441 | ) | -1 | % | (13,519 | ) | (11,881 | ) | 14 | % |
| Other income (expenses) | (16 | ) | 44 | N.A. | 221 | N.A. | 97 | 311 | -69 | % | ||||||
| EBT | 10,140 | 9,990 | 2 | % | -1,462 | N.A. | 23,387 | 3,263 | 616.7 | % | ||||||
| Total taxes | (717 | ) | (1,211 | ) | -41 | % | 1,486 | N.A. | (586 | ) | (2,021 | ) | -71 | % | ||
| Current income tax expense | (893 | ) | (862 | ) | 4 | % | (83 | ) | 976 | % | (2,418 | ) | (1,965 | ) | 23 | % |
| Deferred income tax expense | 176 | (349 | ) | N.A. | 1,569 | -89 | % | 1,832 | (56 | ) | N.A. | |||||
| Profit for the period | 9,423 | 8,779 | 7 | % | 24 | N.A. | 22,801 | 1,242 | N.A. | |||||||
In Q3 2025, Apoena production was 9,248 GEO, up 13% from Q2 2025, driven by improved recovery rates of 95%. Compared to Q3 2024, production rose 15%, fueled by higher recovery rates and increased processed tonnage. For 9M 2025, production fell 12% versus 9M 2024, primarily due to elevated grades in 9M 2024, particularly in Q1 2024, from the high-grade Ernesto pit. Overall, 2025 performance exceeded Company expectations.
Apoena’s Net Revenue totaled US$31.2 million for Q3 2025, 17% higher than Q2 2025 and 62% above the Q3 2024, driven primarily by increased sales volume and higher gold prices. In 9M 2025, Apoena reached a Net Revenue of US$84.3 million, an increase of 31% compared to 9M 2024, supported by higher gold prices that partially offset lower sales volume during the period.
The Cash Cost was US$1,082/GEO for the quarter, down 1% from Q3 2024 and 7% from Q2 2025. The quarter-over-quarter decrease was primarily driven by improved recovery rates, partially offset by a higher strip ratio during the development phase. Year over year, Apoena’s Cash Cost rose 18% to US$1,082/GEO in Q3 2025, driven by an increased waste-to-ore ratio from 6.56 tonnes in Q3 2024 to 19.04 tonnes in Q3 2025, combined with lower grades. For 9M 2025, All-in Sustaining Cost increased 16% to US$1,867/GEO, primarily due to lower grades, consistent with expected mine sequencing. In Q3 2025, Apoena’s AISC was US$1,791/GEO,mostly stable compared to Q2 2025, due to the increased lease expenses.
Apoena’s Adjusted EBITDA in Q3 2025 reached US$20.7 million, a 115% increase from Q3 2024 and 28% higher than Q2 2025, driven by a 62% rise in Net Revenue from higher sales volume and gold prices. For 9M 2025, Adjusted EBITDA was US$50.4 million, up 54% from 9M 2024, supported by a 31% increase in Net Revenue from higher gold prices, despite an AISC due to lower grades and mine sequencing.
3.3 Minosa
| (US$ thousand) | Q3 2025 | Q2 2025 |
QoQ Change % |
Q3 2024 |
YoY Change% |
9M 2025 | 9M 2024 | Change % | ||||||||
| Production (GEO) | 18,138 | 18,039 | 1 | % | 20,750 | -13 | % | 53,831 | 59,078 | -9 | % | |||||
| Sales (GEO) | 17,827 | 17,836 | 0 | % | 20,757 | -14 | % | 53,189 | 59,723 | -11 | % | |||||
| Cash Cost (US$/GEO) | 1,192 | 1,178 | 1 | % | 998 | 19 | % | 1,173 | 1,090 | 8 | % | |||||
| AISC (US$/GEO) | 1,378 | 1,292 | 7 | % | 1,089 | 27 | % | 1,307 | 1,176 | 11 | % | |||||
| Net Revenue | 59,204 | 55,776 | 6 | % | 49,184 | 20 | % | 163,042 | 128,793 | 27 | % | |||||
| Cost of goods sold | (22,486 | ) | (22,056 | ) | 2 | % | (21,809 | ) | 3 | % | (66,018 | ) | (69,022 | ) | -4 | % |
| Gross Profit | 36,718 | 33,720 | 9 | % | 27,375 | 34 | % | 97,024 | 59,771 | 62 | % | |||||
| Expenses | (2,031 | ) | (1,430 | ) | 42 | % | (1,648 | ) | 23 | % | (4,832 | ) | (4,040 | ) | 20 | % |
| General and administrative expenses | (1,271 | ) | (1,166 | ) | 9 | % | (1,059 | ) | 20 | % | (3,572 | ) | (3,450 | ) | 4 | % |
| Exploration expenses | (760 | ) | (264 | ) | 188 | % | (589 | ) | 29 | % | (1,260 | ) | (590 | ) | 114 | % |
| EBIT | 34,687 | 32,290 | 7 | % | 25,727 | 35 | % | 92,192 | 55,731 | 65 | % | |||||
| Adjusted EBITDA | 35,478 | 33,533 | 6 | % | 26,831 | 32 | % | 96,124 | 59,627 | 61 | % | |||||
| Financial Result | (1,428 | ) | (1,189 | ) | 20 | % | (1,556 | ) | -8 | % | (4,173 | ) | (5,982 | ) | -30 | % |
| Financial expenses | (1,147 | ) | (1,442 | ) | -20 | % | (1,417 | ) | -19 | % | (3,901 | ) | (5,253 | ) | -26 | % |
| Other income (expenses) | (281 | ) | 253 | N.A. | (139 | ) | 102 | % | (272 | ) | (729 | ) | -63 | % | ||
| EBT | 33,259 | 31,101 | 7 | % | 24,171 | 38 | % | 88,019 | 49,749 | 77 | % | |||||
| Total taxes | (8,350 | ) | (7,425 | ) | 12 | % | (6,136 | ) | 36 | % | (21,993 | ) | (14,879 | ) | 48 | % |
| Current income tax expense | (8,725 | ) | (7,774 | ) | 12 | % | (6,352 | ) | 37 | % | (23,110 | ) | (14,860 | ) | 56 | % |
| Deferred income tax expense | 375 | 349 | 7 | % | 216 | 74 | % | 1,117 | (19 | ) | N.A. | |||||
| Profit for the period | 24,909 | 23,676 | 5 | % | 18,035 | 38 | % | 66,026 | 34,870 | 89 | % | |||||
In Q3 2025, Minosa produced 18,138 GEO, another stable quarter and in line when compared to the previous quarter, resulting from higher grades processed during the quarter and higher recovery rate, which achieved 68%. When compared to the same quarter last year, production decreased by 13%, due to lower stacking in Q3 2025 compared to Q3 2024 due to higher rainfall in Q3 2025. In the 9M 2025, production decreased 9% mainly due to lower ore feed to the plant, reflecting mine sequencing and weather-related constraints, and was consistent with Aura’s expectations.
Net Revenue totaled US$59.2 million in Q3 2025, up 6% from Q2 2025, while in comparison to Q3 2024 it grew 20%, mainly due to the increase in the price of gold over the period. In 9M 2025, Net Revenue reached US$163.0 million, 27% higher than 9M 2024.
The Cash Cost was US$1,192/GEO in Q3 2025, 1% higher than Q2 2025 and 9% higher than Q3 2024, driven by lower production due to reduced stacking volumes. For 9M 2025, Cash Cost was US$1,173/GEO, an 8% increase from 9M 2024, attributed to lower grades and slightly elevated mine costs. The All-in Sustaining Cost (AISC) for Q3 2025 was US$1,372/GEO, up 6% from Q2 2025 and 26% from Q3 2024, primarily due to higher Capital Expenditures (CAPEX). For 9M 2025, AISC was US$1,305/GEO, an 11% increase over 9M 2024, reflecting the combined impact of lower grades and increased CAPEX.
In Q3 2025, Minosa’s Adjusted EBITDA reached US$35.5 million, up 32% from Q3 2024 and 5% from Q2 2025, driven by higher gold prices, despite reduced production from lower stacking volumes due to increased rainfall and higher CAPEX. For 9M 2025, Adjusted EBITDA was US$96.1 million, a 61% increase from 9M 2024, supported by elevated gold prices, though impacted by lower grades, higher mine costs, and increased CAPEX due to mine sequencing and weather constraints.
3.4 Almas
| (US$ thousand) | Q3 2025 | Q2 2025 |
QoQ Change % |
Q3 2024 |
YoY Change% |
9M 2025 | 9M 2024 | Change % | ||||||||
| Production (GEO) | 15,089 | 12,917 | 17 | % | 14,975 | 1 | % | 41,107 | 37,450 | 10 | % | |||||
| Sales (GEO) | 15,089 | 12,917 | 17 | % | 14,975 | 1 | % | 41,107 | 37,450 | 10 | % | |||||
| Cash Cost (US$/GEO) | 986 | 1,167 | -16 | % | 899 | 10 | % | 1,069 | 1,065 | 0 | % | |||||
| AISC (US$/GEO) | 1,132 | 1,364 | -17 | % | 1,182 | -4 | % | 1,225 | 1,330 | -8 | % | |||||
| Net Revenue | 51,329 | 41,751 | 23 | % | 37,002 | 39 | % | 130,207 | 85,481 | 52 | % | |||||
| Cost of goods sold | (18,147 | ) | (18,036 | ) | 1 | % | (15,569 | ) | 17 | % | (52,697 | ) | (46,977 | ) | 12 | % |
| Gross Profit | 33,182 | 23,715 | 40 | % | 21,432 | 55 | % | 77,510 | 38,504 | 101 | % | |||||
| Expenses | (1,595 | ) | (1,898 | ) | -16 | % | (941 | ) | 70 | % | (4,533 | ) | (2,938 | ) | 54 | % |
| General and administrative expenses | (1,107 | ) | (1,475 | ) | -25 | % | (941 | ) | 18 | % | (3,385 | ) | (2,938 | ) | 15 | % |
| Exploration expenses | (488 | ) | (423 | ) | 15 | % | - | N.A. | (1,148 | ) | - | N.A. | ||||
| EBIT | 31,587 | 21,817 | 45 | % | 20,491 | 54 | % | 72,977 | 35,566 | 105 | % | |||||
| Adjusted EBITDA | 34,525 | 24,709 | 40 | % | 22,931 | 51 | % | 81,661 | 43,993 | 86 | % | |||||
| Financial Result | (2,426 | ) | (4,468 | ) | -46 | % | (1,371 | ) | 77 | % | (10,640 | ) | (5,877 | ) | 81 | % |
| Financial expenses | (2,421 | ) | (4,448 | ) | -46 | % | (1,345 | ) | 80 | % | (10,609 | ) | (5,832 | ) | 82 | % |
| Other income (expenses) | (5 | ) | (20 | ) | -75 | % | (26 | ) | -81 | % | (31 | ) | (45 | ) | -31 | % |
| EBT | 29,161 | 17,349 | 68 | % | 19,120 | 52.5 | % | 62,337 | 29,689 | 110.0 | % | |||||
| Total taxes | (8,478 | ) | (1,226 | ) | 892 | % | 4,194 | N.A. | (14.461 | ) | (4,123 | ) | 87 | % | ||
| Current income tax expense | (9,614 | ) | (7,101 | ) | 35 | % | 3,937 | N.A. | (22,713 | ) | 1,863 | N.A. | ||||
| Deferred income tax expense | 1,136 | 5,875 | -80 | % | 257 | 911 | % | 8,252 | (5,986 | ) | N.A. | |||||
| Profit for the period | 20,683 | 16,123 | 28 | % | 23,314 | -11 | % | 47,876 | 25,566 | 251 | % | |||||
During Q3 2025, Almas produced 15,088 GEO, 17% higher than Q2 2025 (12,917 GEO), driven by improved grades (1.01 g/ton vs. 0.94g/ton) and higher ore processed volumes, reflecting the results of the plant expansion. Production was in line when compared to Q3 2024, due to the higher ore processed, as the grades decreased due to mine sequencing (1.21 g/ton in Q3 2024). In the 9M 2025, production increased 10%, driven by a higher volume of ore processed, due to the plant capacity expansion.
Net Revenue was US$51.3 million in Q3 2025, up 39% from Q3 2024, driven by increased sales volumes, supported by higher ore processing from the plant expansion, and elevated metal prices. Compared to Q2 2025, Net Revenue rose 23%, primarily due to a significant rise in gold prices and a 17% increase in production volumes. For 9M 2025, Net Revenue was US$130.2 million, a 52% increase from 9M 2024, fueled by higher sales volumes from enhanced operational capacity and larger equipment, alongside higher metal prices.
The Cash Cost was US$986/GEO in Q3 2025, 10% higher than Q3 2024, driven by lower grades due to mine sequencing. Compared to Q2 2025, Cash Cost fell 16%, attributed to a production plan with a lower waste-to-ore (from 6.08 to 4.44) ratio and higher grades (up 7% from 0.94 to 1.01). For 9M 2025, Cash Cost remained in line with 9M 2024. Almas’ All-in Sustaining Cost was US$1,128/GEO in Q3 2025, down 5% from Q3 2024, supported by improved operational performance and reduced CAPEX. Compared to Q2 2025, AISC decreased 17%, due to lower CAPEX and G&A expenses. In 9M 2025, the AISC was US$1,223, a decrease of 8% compared to the same period in 2024.
Adjusted EBITDA totaled US$34.5 million in Q3 2025, 51% higher than Q3 2024 result, driven by increased ore processing from the plant expansion, improved operational performance, higher sales volumes, and elevated gold prices. Compared to Q2 2025, Adjusted EBITDA rose 38%, primarily due to higher gold prices and a 17% increase in production volumes. For 9M 2025, Adjusted EBITDA was US$81.7 million, an 86% increase from 9M 2024, supported by higher sales volumes from expanded operational capacity, despite stable Cash Costs and an 8% reduction in AISC to US$1,223/GEO.
3.5 Borborema
| (US$ mil) | Q3 2025 | Q2 2025 | ||
| Production (GEO) | 10,219 | 2,577 | ||
| Sales (GEO) | 11,228 | 1,190 | ||
| Cash Cost (US$/GEO) | 1,127 | 936 | ||
| AISC (US$/GEO) | 1,237 | 1,441 | ||
| Net Revenue | 38,982 | 3,690 | ||
| Cost of goods sold | (12,652 | ) | (1,114 | ) |
| Gross Profit | 26,330 | 2,576 | ||
| Expenses | (1,186 | ) | (378 | ) |
| General and administrative expenses | (869 | ) | (378 | ) |
| Exploration expenses | (317 | ) | - | |
| EBIT | 25,144 | 2,198 | ||
| Adjusted EBITDA | 25,144 | 2,084 | ||
| Financial Result | (252 | ) | (4,971 | ) |
| Finance expense | (232 | ) | (4,982 | ) |
| Other income (expenses) | (20 | ) | 11 | |
| EBT | 24,892 | (2,773 | ) | |
| Total taxes | (522 | ) | (309 | ) |
| Current income tax expense | (6,585 | ) | - | |
| Deferred income tax expense | 6,063 | (309 | ) | |
| Profit/(loss) for the period | 24,370 | (3,082 | ) | |
Note: Borborema’s Q2 2025 results did not presented significant sales due to the beginning of gold production on its ramp-up phase, while Q3 2025 counts with a full quarter of relevant sales. Due to this, the results of Q3 2025 and Q2 2025 are not comparable.
Borborema production in Q3 2025 totaled 10,219 GEO advancing along the ramp-up curve and achieving commercial production in September 2025 as scheduled.
In Q3 2025, Borborema’s Net Revenue reached US$38.9 million, contributing to a 9M 2025 Net Revenue of US$42.7 million. The Cash Cost was US$1,127 per Gold Equivalent Ounce (GEO) in Q3 2025, in line with Company expectations for the mine’s ramp-up phase, which began with the first gold production shipped in June 2025. Borborema’s All-in Sustaining Cost (AISC) was US$1,237/GEO in Q3 2025, also in line with the Company’s expectations for this stage of Borborema.
Adjusted EBITDA was US$25.1 million in Q3 2025, driven by strong Net Revenue from 10,219 GEO produced and favorable gold prices.
4. Cash Flow
| (US$ thousand) | Q3 2025 | Q2 2025 |
QoQ Change % |
Q3 2024 |
YoY Change% |
9M 2025 | 9M 2024 | Change % | ||||||||
| Adjusted EBITDA | 152,105 | 106,224 | 43 | % | 77,974 | 95 | % | 339,808 | 186,813 | 82 | % | |||||
| (+) Exploration Expenses | 2,333 | 1,714 | 36 | % | 4,293 | -46 | % | 5,423 | 9,186 | -41 | % | |||||
| (-) Sustaining Capex | (14,335 | ) | (15,151 | ) | -5 | % | (10,570 | ) | -36 | % | (40,377 | ) | (27,770 | ) | 45 | % |
| (+/-) ∆ Working Capital, Changes in Other Assets and Liabilities and Others | (26,033 | ) | 7,024 | N.A | 3,065 | N.A | (37,092 | ) | (26,670 | ) | 39 | % | ||||
| (-) Income Taxes Paid | (17,755 | ) | (22,570 | ) | -21 | % | (3,728 | ) | 376 | % | (57,199 | ) | (15,162 | ) | 277 | % |
| (-) Lease Payments | (4,551 | ) | (5,122 | ) | -11 | % | (4,810 | ) | -5 | % | (13,912 | ) | (13,490 | ) | 3 | % |
| (-) Realized Losses on Gold Hedges | (17,130 | ) | (11,699 | ) | 46 | % | - | 0 | % | (34,869 | ) | - | 0 | % | ||
| Recurring Free Cash Flow | 74,633 | 60,420 | 24 | % | 66,224 | 13 | % | 161,781 | 112,907 | 43 | % | |||||
In Q3 2025, Recurring Free Cash Flow reached US$74.6 million, up 24% from Q2 2025 and 13% from Q3 2024. Compared to Q2 2025, the increase was primarily driven by:
- 43% rise in Adjusted EBITDA to US$152.1 million, due to higher sales volumes and higher metal prices;
- 21% reduction in income taxes paid (from US$22.6 million to US$17.8 million), as in Q2 2025 there were annual adjustment tax payments in Minosa;
- These were partially offset by:
- “Working Capital, Changes in Other Assets and Liabilities and Others outflow of US$26.0 million, mainly due to increase in low-grades stockpiles in Almas and Borborema; and
- increase in realized losses on gold hedges (to US$17.1 million), resulted from the gold price increase.
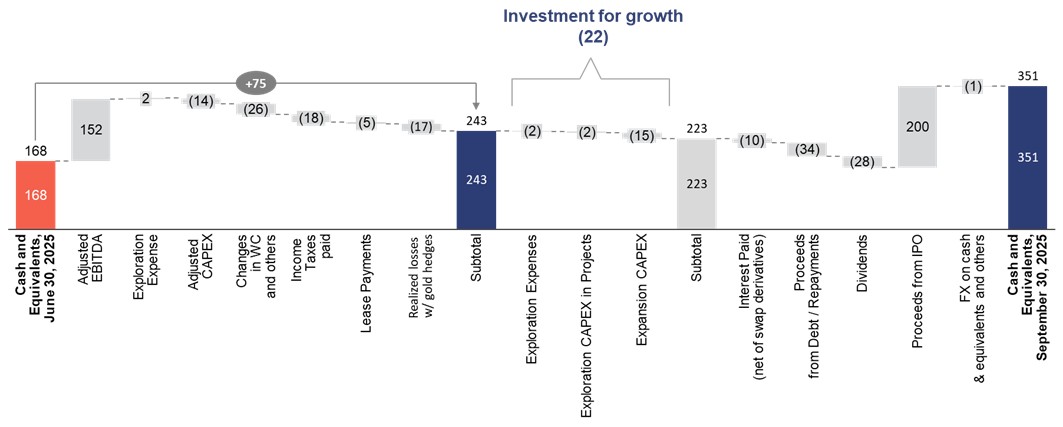
The chart below shows the change in cash position for the three months ending September 30, 2025, from a management perspective:
Changes to the Cash Position Q2 2025 vs. Q3 2025 – Managerial View (US$ Million)
Changes to the Cash Position Q4 2024 vs. Q3 2025 – Managerial View (US$ Million)
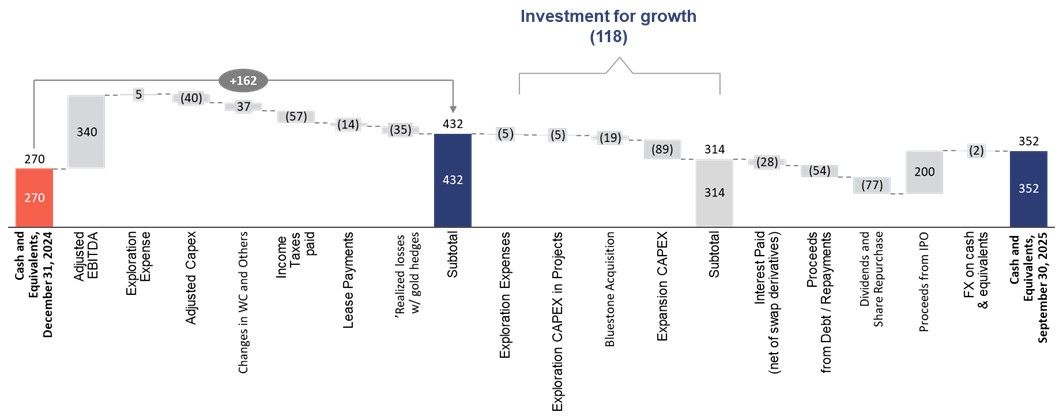
Note: Adjusted Capex includes Exploration and Expansion Capex.
5. Investment
The Company’s consolidated Capex for Q3 2025 totaled US$31.6 million. The main investment headlines for the quarter include:
- Expansion of Capex: US$15.6 million, concentrated mainly on Apoena and Almas, where US$5.1 million was invested at Apoena, US$3.4 million at Almas, US$1.1 at Era Dorada and the remaining US$0.4 million was at Borborema and Minosa. Other expansion projects totaled US$4.7 million.
- Maintenance Capex: US$11.7 million, of which US$5.7 million was allocated to Aranzazu, US$1.8 million to Apoena, and US$1.2 million to Almas, US$2.0 million to Minosa and US$0.9 million to Borborema.
-
Exploration Capex: US$4.5 million, allocated to exploration activities. Apoena led investment with US$1.4 million, followed by Aranzazu with US$0.9 million. Other exploration projects totaled US$2.2 million.
6. Gross and Net Debt
Total gross debt (short and long-term portion) was US$429,776 at the end of Q3 2025, a decrease when compared to U$453,893 at the end of Q2 2025. This decrease was mainly driven by interest and principal payments in the quarter.
The Company’s cash position remains comfortable, closing out the year at US$351,414, due to the Nasdaq IPO and strong Recurring Cash Flows.
The Company's Net Debt reached US$63,772 by Q3 2025 a 77% decrease compared to Q2 2025 and also a decrease of 56% when compared to the same period of 2024, due to (i) higher cash position due to the net proceeds from Nasdaq IPO of US$200.1 million, (ii) strong Recurring Free Cash Flows, (iii) the significant reduction in the CAPEX of US$31.6 million, 37% lower than Q2 2025 CAPEX (US$50.3 million), mostly related to lower CAPEX at Borborema due to the conclusion of the construction, despite payment of dividends of US$27.6 million. The net debt-to-last 12 months EBITDA ratio reduced to 0.15x at the end of Q3 2025, from 0.81x at the end of Q2 2025.
Net Debt Breakdown
| (US$ thousand) | Q3 2025 | Q2 2025 | QoQ Change % | Q3 2024 | YoY Change % | ||
| Loans and debentures (current) | 89,810 | 78,786 | 14 | % | 163,115 | -45 | % |
| Loans and debentures (non-current) | 339,966 | 375,107 | -9 | % | 177,444 | 92 | % |
| Gross debt | 429,776 | 453,893 | -5 | % | 340,559 | 26 | % |
| Cash and cash equivalents | 351,414 | 167,938 | 109 | % | 195,979 | 79 | % |
| Derivative financial instrument (Almas Swap) | 14,590 | 5,395 | 170 | % | 214 | 6718 | % |
| Net Debt | 63,772 | 280,560 | -77 | % | 144,366 | -56 | % |
| Net Debt/LTM EBITDA | 0.15x | 0.81x | -0.7 | x |
0.63x | -0.5 | x |
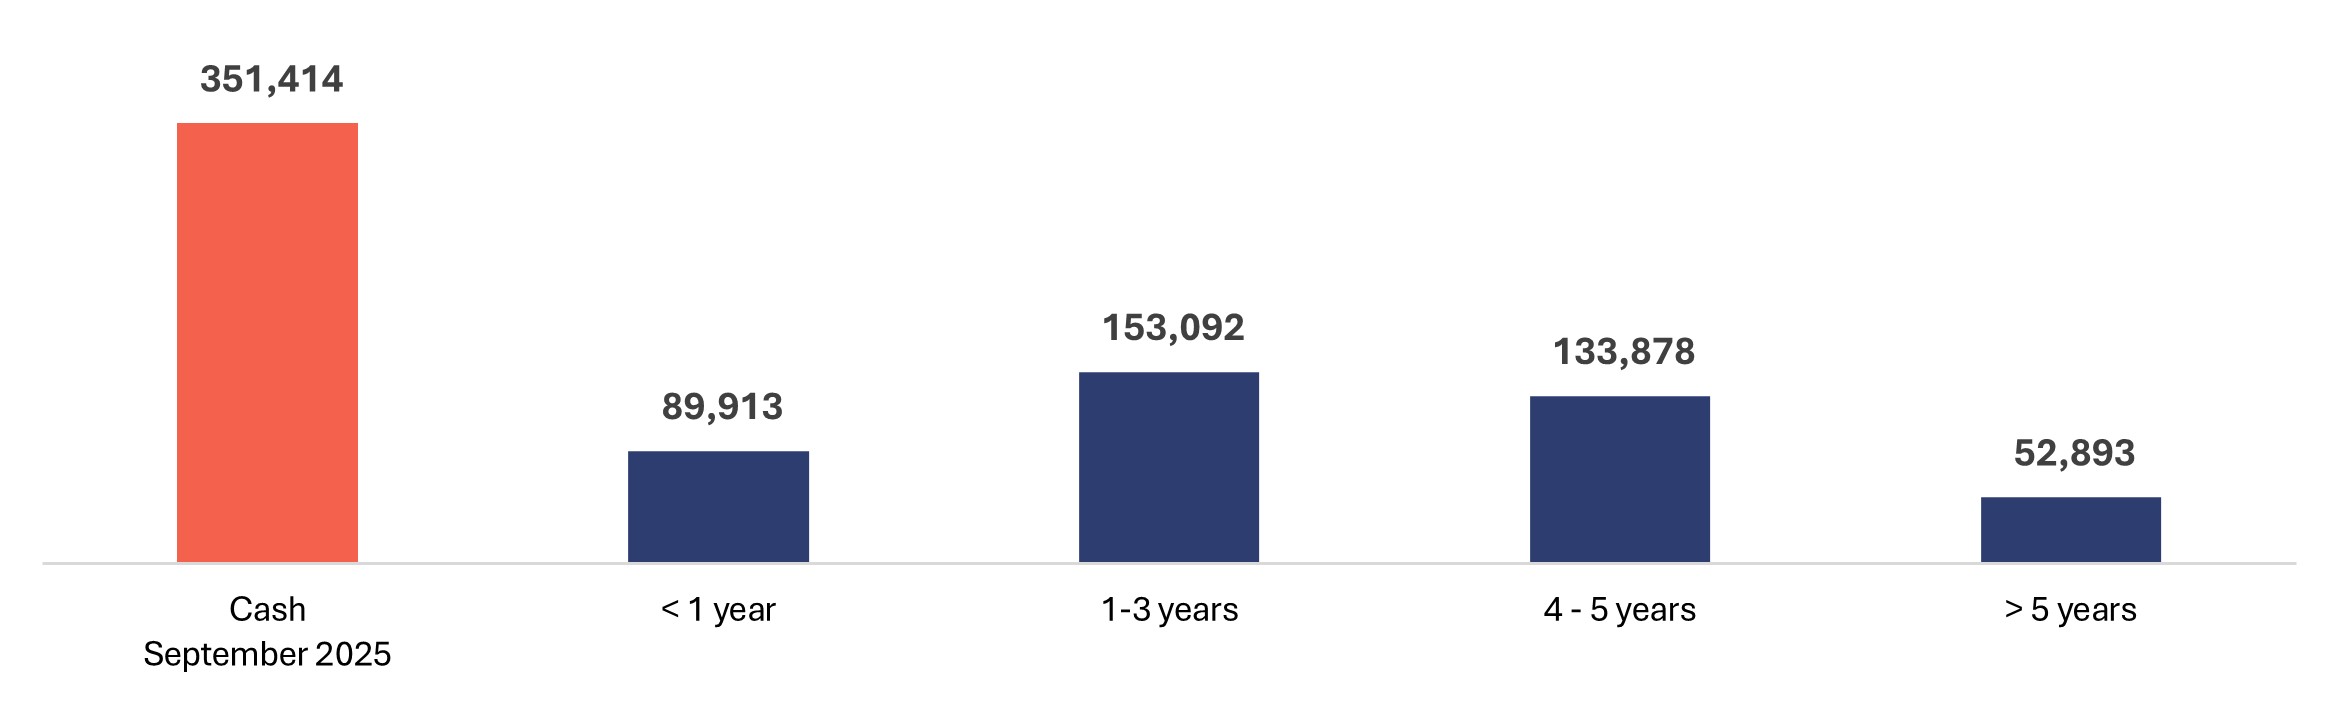
The table below shows the debt amortization timeline:
Debt Amortization Timeline (US$ thousand)
7. Guidance vs. Actual1
The Company is on track to achieve the 2025 Guidance, including Production, Cash Cost, All-in Sustaining Cost (AISC) and CAPEX, as shown in the results below:
|
Gold equivalent ounces production ('000 GEO) – 2025 |
||||||
| Lower Bound | Upper Bound | 9M 2025 A |
9M 2025 at Guidance metal prices |
% | ||
| Aranzazu | 88 | 97 | 64 | 70 | 79% - 72% | |
| Apoena | 29 | 32 | 26 | 26 | 91% - 82% | |
| Minosa | 64 | 73 | 54 | 54 | 84% - 74% | |
| Almas | 51 | 58 | 41 | 41 | 80% - 70% | |
| Total ex-Borborema | 233 | 260 | 186 | 191 | 82% - 73% | |
| Borborema | 33 | 40 | 13 | 13 | 39% - 32% | |
| Total | 266 | 300 | 198 | 204 | 77% - 68% | |
|
Cash Cost per equivalent ounce of gold produced – 2025 |
|||||||
| Lower Bound | Upper Bound | 9M 2025 A | 9M 2025 at Guidance metal prices | % | |||
| Aranzazu | 1,029 | 1,132 | 1,135 | 1,002 | 97% - 88% | ||
| Apoena | 1,258 | 1,384 | 1,159 | 1,159 | 92% - 84% | ||
| Minosa | 1,108 | 1,219 | 1,173 | 1,173 | 106% - 96% | ||
| Almas | 1,013 | 1,114 | 1,167 | 1,167 | 115% - 105% | ||
| Borborema | 1,084 | 1,232 | 1,109 | 1,109 | 102% - 90% | ||
| Total | 1,078 | 1,191 | 1,133 | 1,086 | 101% - 91% | ||
|
AISC per equivalent ounce of gold produced – 2025 |
||||||
| Lower Bound | Upper Bound | 9M 2025 A | 9M 2025 at Guidance metal prices | % | ||
| Aranzazu | 1,348 | 1,455 | 1,523 | 1,344 | 100% - 92% | |
| Apoena | 2,425 | 2,619 | 1,771 | 1,867 | 73% - 68% | |
| Minosa | 1,263 | 1,364 | 1,305 | 1,305 | 103% - 96% | |
| Almas | 1,113 | 1,202 | 1,223 | 1,223 | 110% - 102% | |
| Borborema | 1,113 | 1,304 | 1,256 | 1,256 | 113% - 96% | |
| Total | 1,374 | 1,492 | 1,419 | 1,373 | 99% - 91% | |
|
Capex (US$ million) – 2025 |
|||||
| Low - 2025 | High - 2025 | 9M 2025 A | % | ||
| Sustaining | 40 | 47 | 34 | 84% - 72% | |
| Exploration | 10 | 13 | 11 | 113% - 84% | |
| New projects + Expansion | 99 | 106 | 96 | 97% - 91% | |
| Total | 149 | 167 | 141 | 85% - 95% | |
______________________________
1 Key Factors:
The Company’s future profitability, operating cash flow and financial position will be directly related to prevailing gold and copper prices. Key factors that influence the price of gold and copper include, among others, the supply and demand for gold and copper, the relative strength of currencies (especially the US dollar) and macroeconomic factors, such as current and future expectations for inflation and interest rates. Management believes that the economic environment in the short and medium term should remain relatively favorable with respect to commodity prices, albeit with continued volatility.
To reduce the risks associated with commodity prices and currency volatility, the Company will continue to assess and deploy hedging programs. For more information on this subject, please refer to the Reference Form.
Other key factors influencing profitability and operating cash flows are: production levels (affected by grades, ore quantities, process recoveries, labor, country stability and availability of facilities and equipment); production and processing costs (impacted by production levels, prices and the use of key consumables, labor, inflation and exchange rates), and other factors.
8. Shareholder Information
As of September 30, 2025, the Company had the following outstanding: 83,534,506 Common Shares, 1,493,492 stock options, and 189,795 deferred share units.
9. Attachments
9.1 Financial Statements
| (US$ thousand) | Q3 2025 | Q2 2025 |
QoQ Change % |
Q3 2024 |
YoY Change% |
9M 2025 | 9M 2024 | Change % | ||||||||
| Net revenue | 247,832 | 190,436 | 30 | % | 156,157 | 59 | % | 600,072 | 422,646 | 42 | % | |||||
| Cost of goods sold | (98,223 | ) | (86,497 | ) | 14 | % | (83,976 | ) | 17 | % | (268,096 | ) | (252,475 | ) | 6 | % |
| Gross profit | 149,609 | 103,939 | 44 | % | 72,181 | 107 | % | 331,976 | 170,171 | 95 | % | |||||
| General and administrative expenses | (10,371 | ) | (11,284 | ) | -8 | % | (6,923 | ) | 50 | % | (31,291 | ) | (22,734 | ) | 38 | % |
| Exploration expenses | (2,333 | ) | (1,714 | ) | 36 | % | (4,293 | ) | -46 | % | (5,423 | ) | (9,186 | ) | -41 | % |
| Operating income | 136,905 | 90,941 | 51 | % | 60,965 | 125 | % | 295,262 | 138,251 | 114 | % | |||||
| Financial expenses | (102,565 | ) | (59,630 | ) | 72 | % | (62,691 | ) | 64 | % | (283,806 | ) | (141,888 | ) | 100 | % |
| Other income (expenses) | (822 | ) | 61 | N.A. | (359 | ) | 129 | % | (1,515 | ) | (952 | ) | 59 | % | ||
| Profit before income taxes | 33,518 | 31,372 | 7 | % | (2,085 | ) | N.A. | 9,941 | (4,589 | ) | N.A. | |||||
| Current income tax expense | (38,402 | ) | (29,551 | ) | 30 | % | (11,833 | ) | 225 | % | (88,767 | ) | (36,588 | ) | 143 | % |
| Deferred income tax expense | 10,510 | 6,326 | 66 | % | 1,995 | 427 | % | 19,350 | (5,738 | ) | N.A. | |||||
| Profit/(loss) for the period | 5,626 | 8,147 | -31 | % | (11,923 | ) | N.A. | (59,476 | ) | (46,915 | ) | 27 | % | |||
9.2 Balance Sheet
| (US$ million) | Q3 2025 | Q2 2025 | Q3 2024 | |||
| ASSETS | ||||||
| Current | ||||||
| Cash and cash equivalents | 351,414 | 167,938 | 195,979 | |||
| Accounts receivables | 13,142 | 4,826 | 15,355 | |||
| Value added taxes and other recoverable taxes | 23,586 | 21,292 | 41,329 | |||
| Inventories | 76,671 | 80,034 | 63,151 | |||
| Derivative financial instrument | 14,590 | 5,395 | 214 | |||
| Other receivables and assets | 28,949 | 21,560 | 19,901 | |||
| Total current assets | 508,352 | 301,045 | 335,929 | |||
| Non-current assets | ||||||
| Value added taxes and other recoverable taxes | 49,843 | 46,329 | 17,148 | |||
| Inventory | 44,406 | 23,025 | 16,472 | |||
| Other receivables and assets | 7,012 | 4,319 | 3,490 | |||
| Property, plant and equipment | 783,346 | 762,566 | 560,993 | |||
| Deferred income tax assets | 35,903 | 28,639 | 20,970 | |||
| Total non-current assets | 920,510 | 864,878 | 619,073 | |||
| Total assets | 1,428,862 | 1,165,923 | 955,002 | |||
| LIABILITIES | ||||||
| Current | ||||||
| Trade and other payables | 125,447 | 111,156 | 100,061 | |||
| Derivative financial instruments | 26,521 | 26,654 | - | |||
| Loans and Debentures | 89,810 | 78,786 | 163,115 | |||
| Liability measured at fair value | 5,322 | 4,850 | 2,350 | |||
| Current income tax liabilities | 46,228 | 28,507 | 18,737 | |||
| Current portion of other liabilities | 15,988 | 14,939 | 14,225 | |||
| Provision for mine closure and restoration | 2,551 | - | - | |||
| Liabilities directly associated with assets classified as held for sale | 2,757 | 2,757 | 4,087 | |||
| Total current liabilities | 314,624 | 267,649 | 302,575 | |||
| Non-current liabilities | ||||||
| Loans and debentures | 339,966 | 375,107 | 177,444 | |||
| Liability measured at fair value | 17,311 | 17,689 | 17,406 | |||
| Derivative Financial Instruments | 297,801 | 222,901 | 133,622 | |||
| Deferred income tax liabilities | 31,888 | 35,925 | 11,360 | |||
| Provision for mine closure and restoration | 64,830 | 64,470 | 52,852 | |||
| Other provisions | 29,215 | 28,467 | 13,986 | |||
| Other liabilities | 10,794 | 13,951 | 15,340 | |||
| Total non-current liabilities | 791,805 | 758,510 | 422,010 | |||
| SHAREHOLDERS' EQUITY | ||||||
| Share capital | 833,382 | 633,271 | 602,909 | |||
| Contributed surplus | 56,937 | 55,669 | 55,560 | |||
| Accumulated other comprehensive income | (1,584 | ) | (4,812 | ) | 2,357 | |
| Accumulated losses | (566,302 | ) | (544,364 | ) | (430,408 | ) |
| Total equity | 322,433 | 139,764 | 230,418 | |||
| Total liabilities and equity | 1,428,862 | 1,165,923 | 955,002 | |||
9.3 Cash Flow Statement
| (US$ thousand) | Q3 2025 | Q2 2025 | Q3 2024 | 9M 2025 | 9M 2024 | |||||
| Cash flows from operating activities | ||||||||||
| Profit /(Loss) for the period | 5,626 | 8,147 | (11,923 | ) | (59,476 | ) | (46,915 | ) | ||
| Items adjusting profit (loss) of the period | 133,542 | 82,263 | 105,657 | 371,374 | 237,672 | |||||
| Changes in working capital | 2,174 | 3,372 | (6,674 | ) | (8,589 | ) | (23,807 | ) | ||
| Income tax paid | (17,755 | ) | (22,570 | ) | (3,728 | ) | (57,199 | ) | (15,162 | ) |
| Other current and non-current assets and liabilities | (30,491 | ) | 8,653 | (6,562 | ) | (31,921 | ) | 4,445 | ||
| Net cash generated by operating activities | 93,096 | 79,865 | 76,770 | 214,189 | 156,233 | |||||
| Cash flows from investing activities | ||||||||||
| Purchase of property, plant and equipment | (31,605 | ) | (50,325 | ) | (60,483 | ) | (133,655 | ) | (113,761 | ) |
| Acquisition of investment – Bluestone Resources | - | - | - | (18,538 | ) | - | ||||
| Acquisition of investment – Altamira | - | (439 | ) | - | (439 | ) | - | |||
| Net cash used in investing activities | (31,605 | ) | (50,764 | ) | (60,483 | ) | (152,632 | ) | (113,761 | ) |
| Cash flows from financing activities | ||||||||||
| Net Proceeds from the Nasdaq IPO | 200,116 | - | - | 200,116 | ||||||
| Proceeds received from loans and debentures | - | - | 39,640 | - | 73,640 | |||||
| Repayment of loans and debentures | (33,728 | ) | (9,147 | ) | (32,017 | ) | (54,330 | ) | (55,329 | ) |
| Derivative settlement- debt swap agreements | (1,418 | ) | 2,582 | 1,186 | 1,164 | 4,054 | ||||
| Derivative fee | - | - | - | - | (13,522 | ) | ||||
| Interest paid on loans and debentures | (8,308 | ) | (13,397 | ) | (11,758 | ) | (29,480 | ) | (29,456 | ) |
| Payment of liability (NSR agreement) | (942 | ) | (852 | ) | (489 | ) | (2,536 | ) | (1,699 | ) |
| Principal and interest payments of lease liabilities | (4,551 | ) | (5,122 | ) | (4,810 | ) | (13,912 | ) | (13,490 | ) |
| Repayment of other liabilities | (1,044 | ) | (1 | ) | (1,749 | ) | (2,025 | ) | (2,573 | ) |
| Payment of dividends | (27,564 | ) | (29,811 | ) | - | (75,708 | ) | (25,339 | ) | |
| Acquisition of treasury shares | - | - | (6,068 | ) | (1,200 | ) | (9,526 | ) | ||
| Proceeds and (payments) from exercise of stock options | - | - | 65 | - | 165 | |||||
| Net cash generated by (used in) financing activities | 122,561 | (55,748 | ) | (16,000 | ) | 22,089 | (73,075 | ) | ||
| Increase (decrease) in cash and cash equivalents | 184,052 | (26,647 | ) | 287 | 83,646 | (30,603 | ) | |||
| Effect of foreign exchange gain (loss) on cash equivalents | (576 | ) | (3,481 | ) | 3,729 | (2,421 | ) | (10,713 | ) | |
| Cash and cash equivalents, beginning of the period | 167,938 | 198,066 | 191,963 | 270,189 | 237,295 | |||||
| Per balance sheet at the end of comparative period | 351,414 | 167,938 | 195,979 | 351,414 | 195,979 | |||||
9.4 Non-GAAP Performance Measures
Set out below are reconciliations for certain non-GAAP financial measures (including non-GAAP ratios) utilized by the Company in this Earnings Release: Adjusted EBITDA; Adjusted net Income, cash operating costs per gold equivalent ounce sold; AISCs; Net Debt; and Adjusted EBITDA Margin, which are non-GAAP financial measures. These non-GAAP measures do not have any standardized meaning within IFRS and therefore may not be comparable to similar measures presented by other companies. The Company believes that these measures provide investors with additional information which is useful in evaluating the Company’s performance and should not be considered in isolation or as a substitute for measures of performance prepared in accordance with IFRS.
A. Reconciliation from income for the quarter to Adjusted EBITDA:
(US$ thousand)
| (US$ thousand) | Q3 2025 | Q3 2024 | 9M 2025 | 9M 2024 | ||||
| Profit / (Loss) for the period | 5,626 | (11,923 | ) | (59,476 | ) | (46,915 | ) | |
| Current income tax expense | 38,402 | 11,833 | 88,767 | 36,588 | ||||
| Deferred income tax expense | (10,510 | ) | (1,995 | ) | (19,350 | ) | 5,738 | |
| Finance expense | 102,565 | 62,691 | 283,806 | 141,888 | ||||
| Other income (expense) | 822 | 359 | 1,515 | 952 | ||||
| Depletion and amortization | 15,200 | 17,108 | 44,546 | 49,198 | ||||
| Adjusted EBITDA | 152,105 | 78,073 | 339,808 | 187,449 |
B. Reconciliation from the consolidated financial statements to cash operating costs per gold equivalent ounce sold:
| (US$ thousand) | Q3 2025 | Q3 2024 | 9M 2025 | 9M 2024 | ||||
| Cost of goods sold | (98,223 | ) | (83,976 | ) | (268,096 | ) | (252,475 | ) |
| Depletion and amortization | 15,058 | 16,686 | 43,870 | 47,577 | ||||
| Subtotal | (83,165 | ) | 67,069 | (224,226 | ) | (204,898 | ) | |
| Gold Equivalent Ounces sold | 74,907 | 67,069 | 197,850 | 200,517 | ||||
| Cash costs per gold equivalent ounce sold | 1,110 | 987 | 1,133 | 1,022 |
C. Reconciliation from the consolidated financial statements to all in sustaining costs per gold equivalent ounce sold:
| (US$ thousand) | Q3 2025 | Q3 2024 | 9M 2025 | 9M 2024 | ||||
| Cost of goods sold | (98,223 | ) | (83,976 | ) | (268,096 | ) | (252,475 | ) |
| Depletion and amortization | 15,058 | 16,686 | 43,870 | 47,577 | ||||
| Subtotal | (83,165 | ) | (67,290 | ) | (224,226 | ) | (204,898 | ) |
| Adjusted capex | 14,196 | 13,535 | 40,240 | 34,725 | ||||
| General and Administrative Expenses | 4,177 | 2,444 | 11,494 | 7,900 | ||||
| Lease Payments | 3,041 | 4,810 | 7,490 | 13,490 | ||||
| Subtotal | (61,751 | ) | (46,500 | ) | (165,002 | ) | (148,783 | ) |
| Gold Equivalent Ounces sold (in thousands) | 74,907 | 67,069 | 197,850 | 200,517 | ||||
| All In Sustaining costs per ounce sold equivalent ounce sold | 1,396 | 1,292 | 1,433 | 1,302 |
D. Reconciliation from the consolidated financial statements to realized average gold price per ounce sold, net2:
| (US$ thousand) | Q3 2025 | Q3 2024 | 9M 2025 | 9M 2024 |
| Gold Revenue, net of Sales Taxes | 180,738 | 105,436 | 420,208 | 278,523 |
| Ounces of gold sold | 53,393 | 43,689 | 133,590 | 126,259 |
| Realized average gold price per ounce sold, net | 3,385 | 2,413 | 3,146 | 2,206 |
E. Net Debt:
| (US$ thousand) | Q3 2025 | Q3 2024 | 9M 2025 | 9M 2024 | ||||
| Loans and debentures (current) | 89,810 | 163,115 | 89,810 | 163,115 | ||||
| Loans and debentures (non-current) | 339,966 | 177,444 | 339,966 | 177,444 | ||||
| Derivative Financial Instrument (Swap – Aura Almas (Itaú Bank) | (14,590 | ) | (214 | ) | (14,590 | ) | (214 | ) |
| Cash and Cash Equivalents | (351,414 | ) | (195,979 | ) | (351,414 | ) | (195,979 | ) |
| Net Debt | 63,772 | 144,366 | 63,772 | 144,366 |
(1) Derivative Financial Instrument: only includes the swap related to the Aura Almas Debenture.
F. Adjusted EBITDA Margin3 (Adjusted EBITDA/Revenues):
| (US$ thousand) | Q3 2025 | Q3 2024 | 9M 2025 | 9M 2024 | ||||
| Net Revenue | 247,832 | 156,157 | 600,072 | 422,646 | ||||
| Adjusted EBITDA | 152,105 | 78,073 | 339,808 | 187,449 | ||||
| Adjusted EBITDA Margin (Adjusted EBITDA/Revenues) | 61 | % | 50 | % | 57 | % | 44 | % |
G. Adjusted Net Income
| (US$ thousand) | Q3 2025 | Q3 2024 | 9M 2025 | 9M 2024 | ||||
| Profit/(Loss) for the period | 5,626 | (11,923 | ) | (59,476 | ) | (46,915 | ) | |
| Foreign exchange gain (loss) | (36 | ) | 2,279 | (5,674 | ) | (10,995 | ) | |
| Loss on derivative transactions | (75,252 | ) | (56,267 | ) | (199,766 | ) | (89,493 | ) |
| Loss on settlement of liability with equity instruments | - | - | (8,768 | ) | - | |||
| Deferred taxes over non-monetary items | 12,242 | 20,415 | 22,323 | 8,943 | ||||
| Adjusted Net Income | 68,672 | 21,650 | 132,409 | 44,630 |
_______________________
2 Realized average gold price per ounce sold, net is a non-GAAP financial measure with no standardized meaning under IFRS, and therefore may not be comparable to similar measures presented by other issuers.
3 Adjusted EBITDA Margin is a non-GAAP financial measure with no standardized meaning under IFRS, and therefore may not be comparable to similar measures presented by other issuers.
Qualified Person
Farshid Ghazanfari, P.Geo., Mineral Resources and Geology Director for Aura Minerals Inc., has reviewed and approved the scientific and technical information contained within this Earnings Release and serves as the Qualified Person as defined in NI 43-101 and S-K 1300. All NI 43-101 technical reports related to properties material to Aura are available on SEDAR+ at sedarplus.ca and all S-K 1300 technical report summaries related to properties material to Aura are available .from the SEC website at www.sec.gov..
About Aura 360° Mining
Aura is focused on mining in complete terms – thinking holistically about how its business impacts and benefits every one of our stakeholders: our company, our shareholders, our employees, and the countries and communities we serve. We call this 360° Mining.
Aura is a company focused on the development and operation of gold and base metal projects in the Americas. The Company's five operating assets include the Minosa gold mine in Honduras; the Almas, Apoena, and Borborema gold mines in Brazil; and the Aranzazu copper, gold, and silver mine in Mexico. Additionally, the Company owns Era Dorada, a gold project in Guatemala; Tolda Fria, a gold project in Colombia; and three projects in Brazil: Matupá, which is under development; São Francisco, which is in care and maintenance; and the Carajás copper project in the Carajás region, in the exploration phase.
CAUTIONARY NOTES AND ADDITIONAL INFORMATION
This Press Release, and the documents incorporated by reference herein, contain certain “forward-looking information” within the meaning of applicable Canadian securities laws and “forward-looking statements” within the meaning of applicable United States securities laws (together, “forward-looking information”). Forward-looking information relates to future events or future performance of the Company and reflect the Company’s current estimates, predictions, expectations or beliefs regarding future events and include, without limitation, statements with respect to: expected production from, and the further potential of the Company’s properties; the ability of the Company to achieve its long-term outlook and the anticipated timing and results thereof (including the guidance set forth herein); the ability to lower costs and increase production; the economic viability of a project; strategic plans, including the Company’s plans with respect to its properties; the amount of mineral reserves and mineral resources; probable mineral reserves; indicated mineral reserves; inferred mineral reserves; the potential conversion of indicated mineral resources into mineral reserves; the amount of future production over any period; capital expenditures and mine production costs; the outcome of mine permitting; other required permitting; information with respect to the future price of minerals; expected cash costs and AISCs; the Company’s ability expand exploration on its properties; the Company’s ability to obtain assay results; the Company’s exploration and development programs; estimated future expenses; exploration and development capital requirements; the amount of mining costs; cash operating costs; operating costs; expected grades and ounces of metals and minerals; expected processing recoveries; expected time frames; prices of metals and minerals; LOM of certain projects; expectations of gold hedging programs; the implementation of cultural initiatives; expected increases to fleet capacities; non-cash losses translating into cash losses; the ability to continue to finance planned growth; access to additional debt; and the repayment of outstanding balances on revolving credit facilities. Often, but not always, forward-looking information may be identified by the use of words such as “expects”, “anticipates”, “plans”, “projects”, “forecasts”, “estimates”, “assumes”, “intends”, “strategy”, “goals”, “objectives” or variations thereof or stating that certain actions, events or results “may”, “could”, “would”, “might” or “will” be taken, occur or be achieved, or the negative of any of these terms and similar expressions.
Forward-looking information is necessarily based upon a number of estimates and assumptions that, while considered reasonable by the Company, are inherently subject to significant business, economic and competitive uncertainties and contingencies. Forward-looking information in this Press Release is based upon, without limitation, the following estimates and assumptions: the ability of the Company to successfully achieve business objectives; the presence of and continuity of metals at the Company’s projects at modeled grades; gold and copper price volatility; the capacities of various machinery and equipment; the availability of personnel, machinery and equipment at estimated prices; exchange rates; metals and minerals sales prices; cash costs and AISCs; the Company’s ability to expand operations; the Company’s ability to obtain assay results; appropriate discount rates; tax rates and royalty rates applicable to the mining operations; cash operating costs and other financial metrics; anticipated mining losses and dilution; metals recovery rates; reasonable contingency requirements; the Company’s expected ability to develop adequate infrastructure and that the cost of doing so will be reasonable; the Company’s expected ability to develop its projects including financing such projects; and receipt of regulatory approvals on acceptable terms.
Known and unknown risks, uncertainties and other factors, many of which are beyond the Company’s ability to predict or control, could cause actual results to differ materially from those contained in the forward-looking information. Specific reference is made to the Company’s most recent AIF for a discussion of some of the factors underlying forward-looking information, which include, without limitation: gold and copper or certain other commodity price volatility; changes in debt and equity markets; the uncertainties involved in obtaining and interpreting geological data; increases in costs; environmental compliance and changes in environmental legislation and regulation; interest rate and exchange rate fluctuations; general economic conditions; political stability; and other risks involved in the mineral exploration and development industry. Readers are cautioned that the foregoing list of factors is not exhaustive of the factors that may affect the forward-looking information.
All forward-looking information herein is qualified by this cautionary statement. Accordingly, readers should not place undue reliance on forward-looking information. The Company undertakes no obligation to update publicly or otherwise revise any forward-looking information whether because of new information or future events or otherwise, except as may be required by law. If the Company does update any forward-looking information, no inference should be drawn that it will make additional updates with respect to such or other forward-looking information.
Photos accompanying this announcement are available at:
https://www.globenewswire.com/NewsRoom/AttachmentNg/17e07f92-0c27-4cf5-b678-cf542542da85
https://www.globenewswire.com/NewsRoom/AttachmentNg/945dcda3-49b8-45e9-8df3-5fa181130280
https://www.globenewswire.com/NewsRoom/AttachmentNg/1302aeef-52ec-46bc-ad0c-682149d4d79e

For more information, please contact:

Investor Relations

ri@auraminerals.com

www.auraminerals.com
![]()
Changes to the Cash Position Q2 2025 vs. Q3 2025 – Managerial View (US$ Million)
Changes to the Cash Position Q2 2025 vs. Q3 2025 – Managerial View (US$ Million)
Changes to the Cash Position Q4 2024 vs. Q3 2025 – Managerial View (US$ Million)
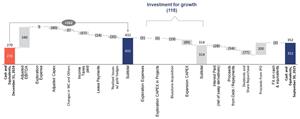
Changes to the Cash Position Q4 2024 vs. Q3 2025 – Managerial View (US$ Million)
Debt Amortization Timeline (US$ thousand)
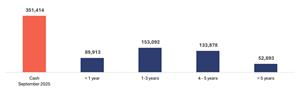
Debt Amortization Timeline (US$ thousand)
Legal Disclaimer:
EIN Presswire provides this news content "as is" without warranty of any kind. We do not accept any responsibility or liability for the accuracy, content, images, videos, licenses, completeness, legality, or reliability of the information contained in this article. If you have any complaints or copyright issues related to this article, kindly contact the author above.
